RIC Dashboard User Guide
This document provides a quickstart for users of the O-RAN SC RIC Dashboard web application.
Main Page
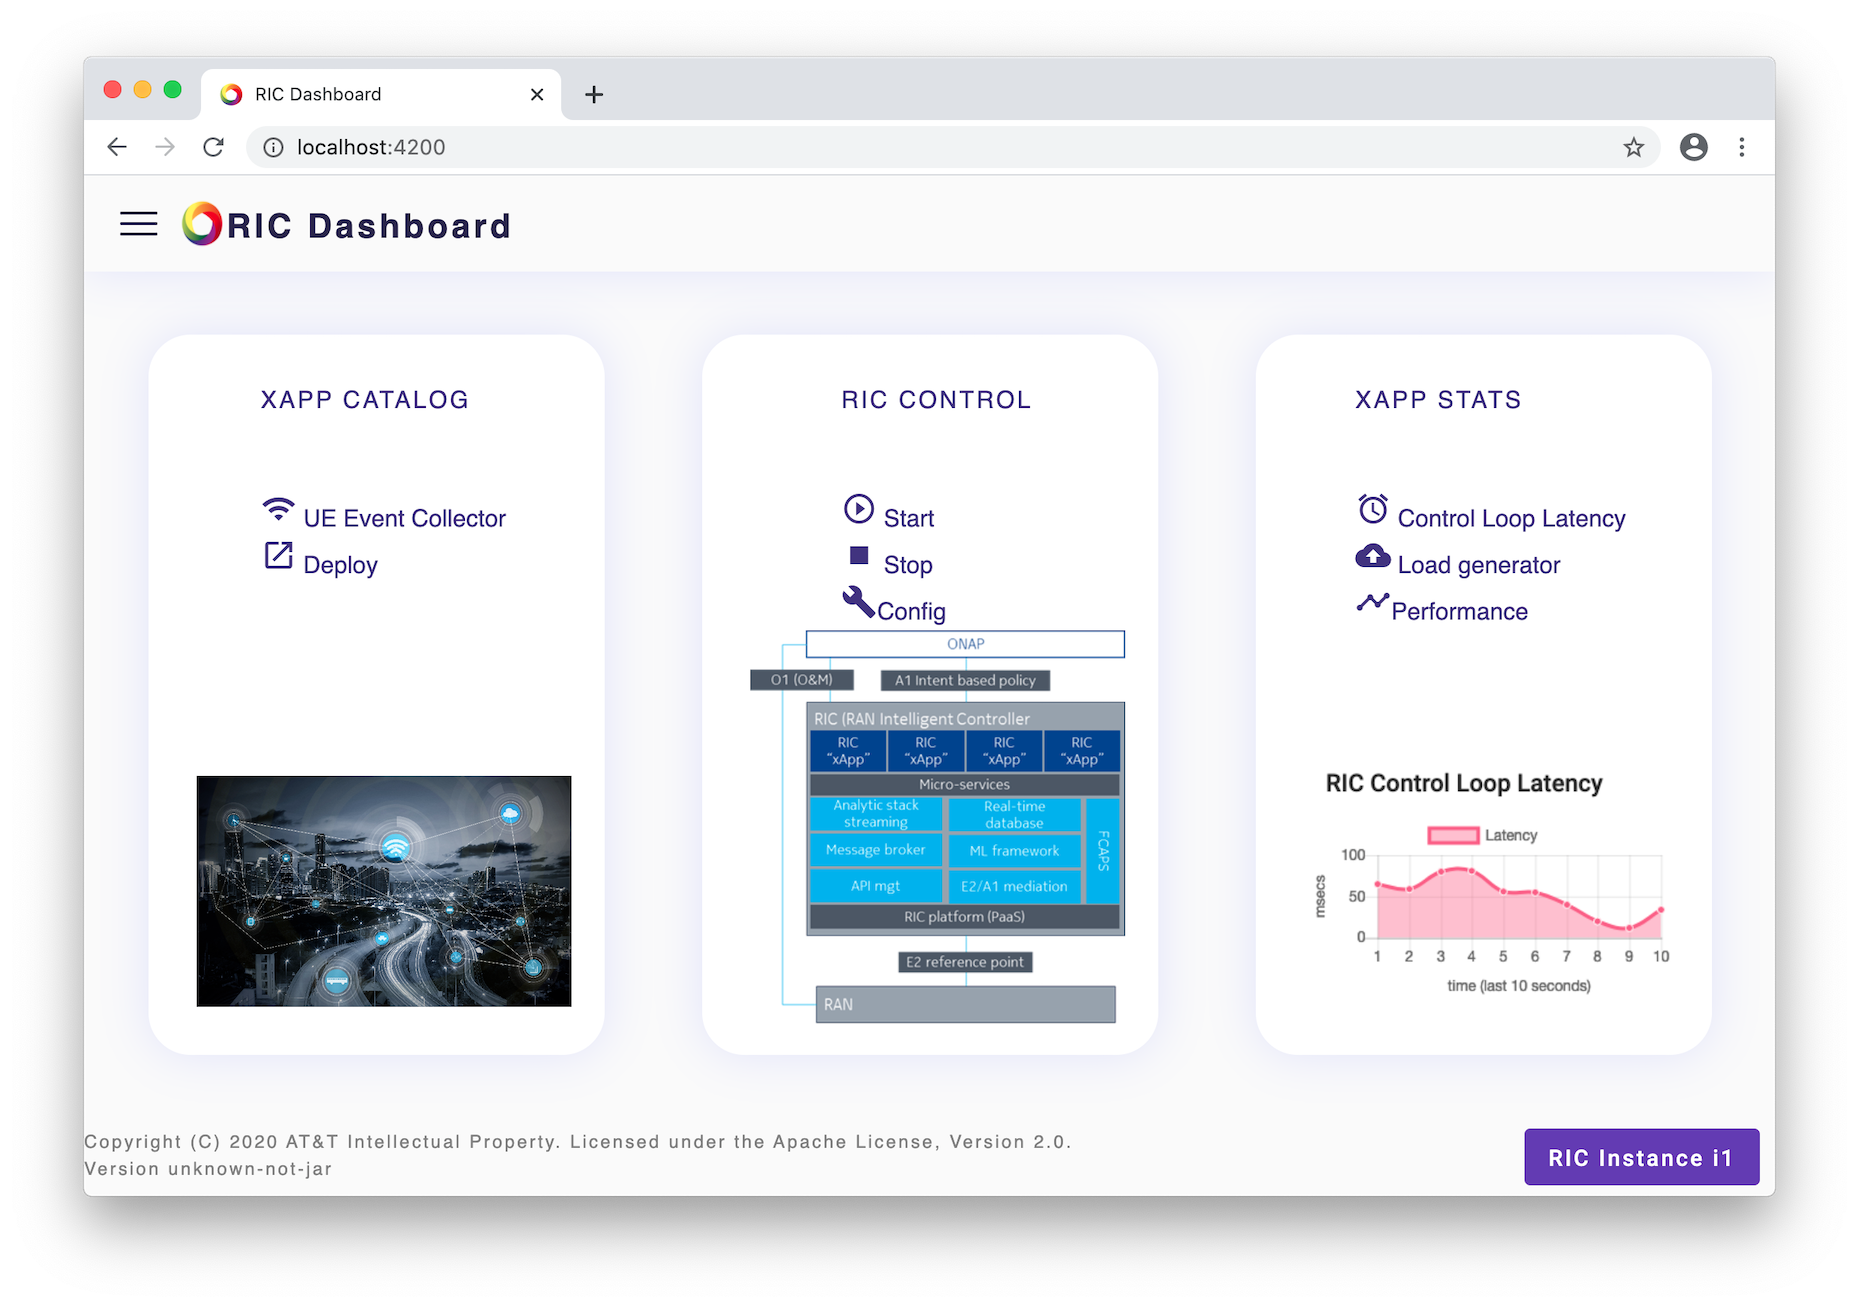
The main (home) page has tiles for catalog, control and application statistics, which are the main three areas of the Dashboard. A screen shot of the main page is shown below.
Left Menu
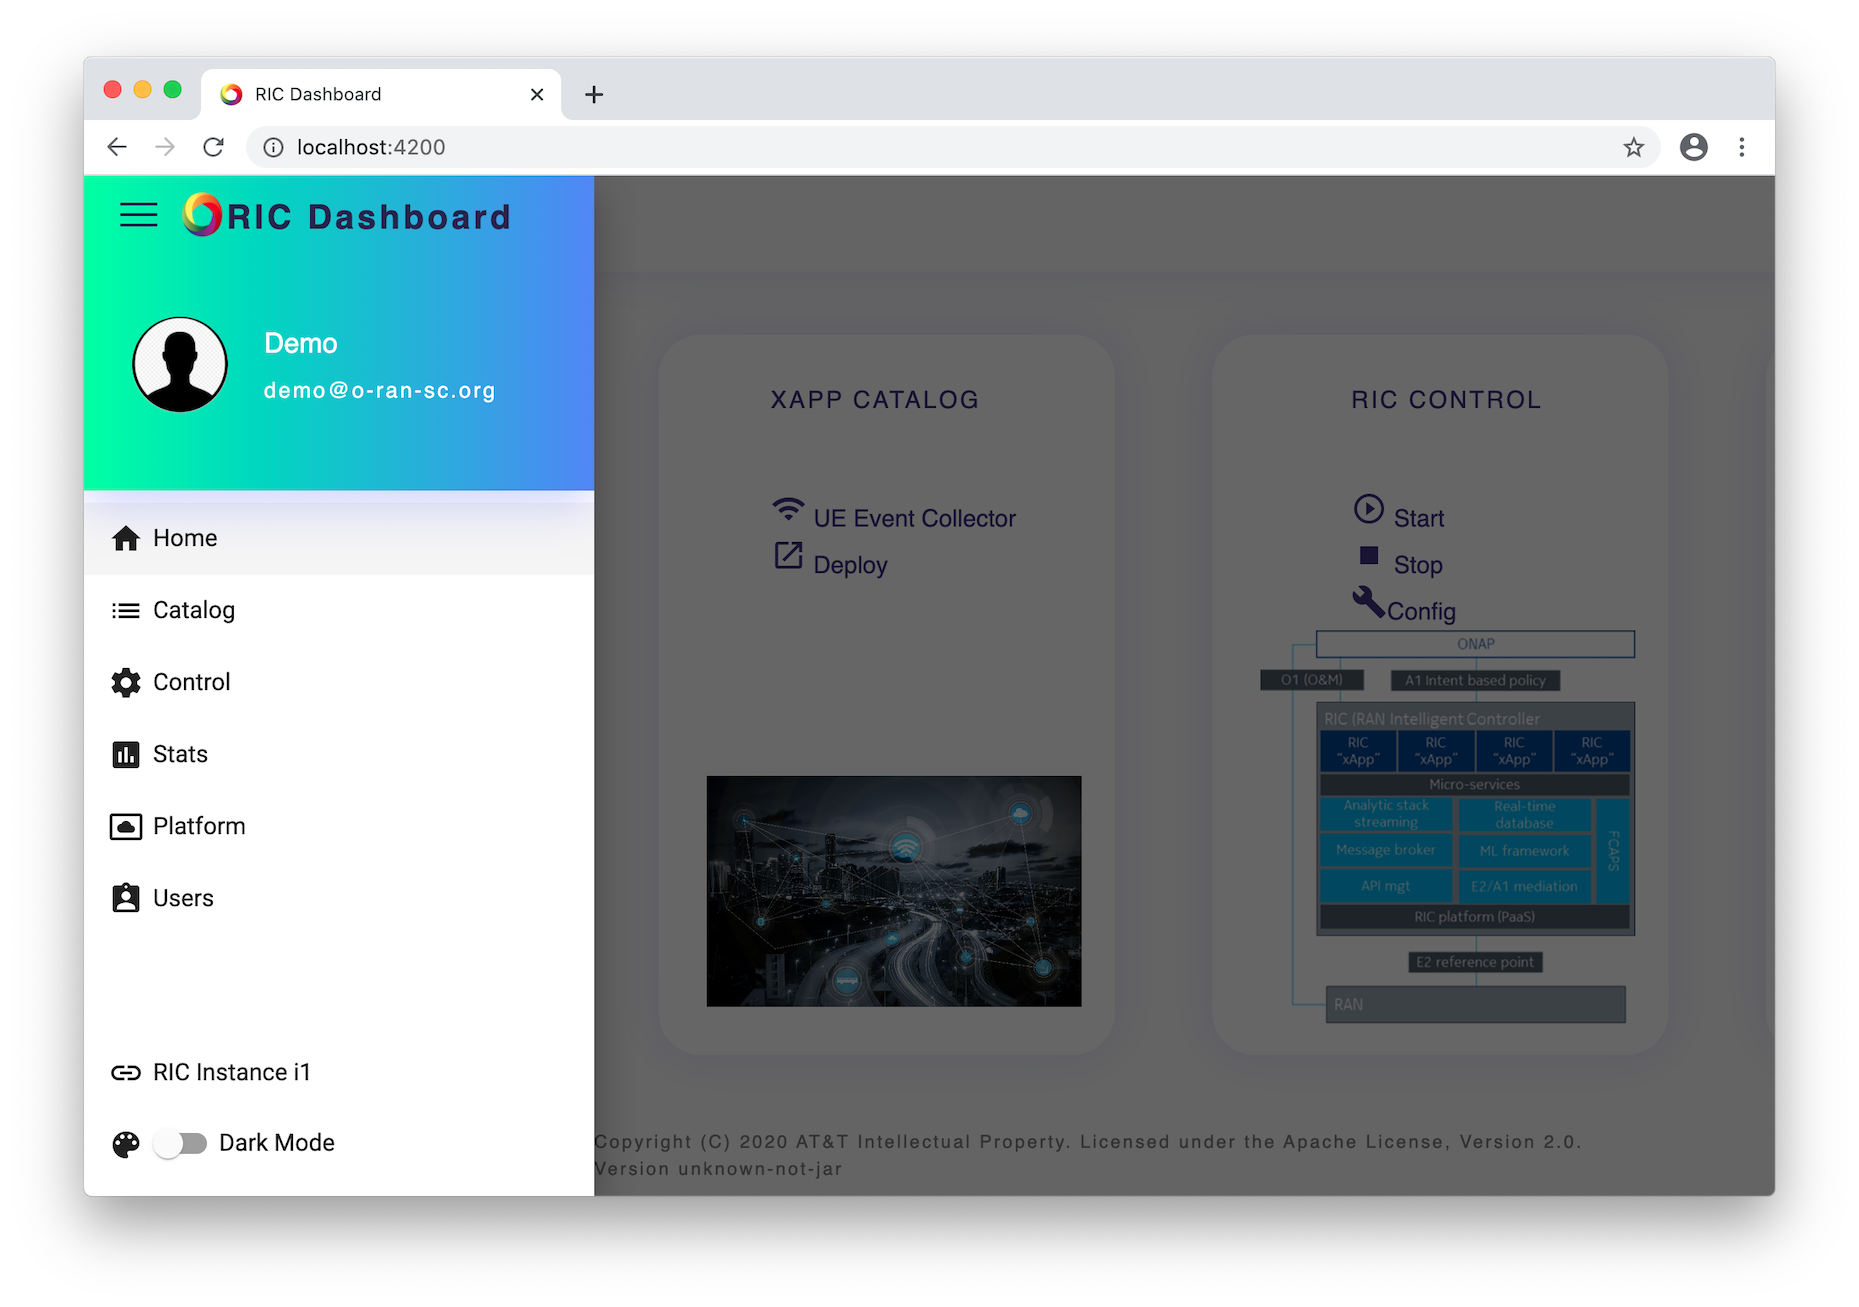
Items on the left menu give access to all features of the RIC Dashboard A screen shot of the menu is shown below.
xRIC Instances
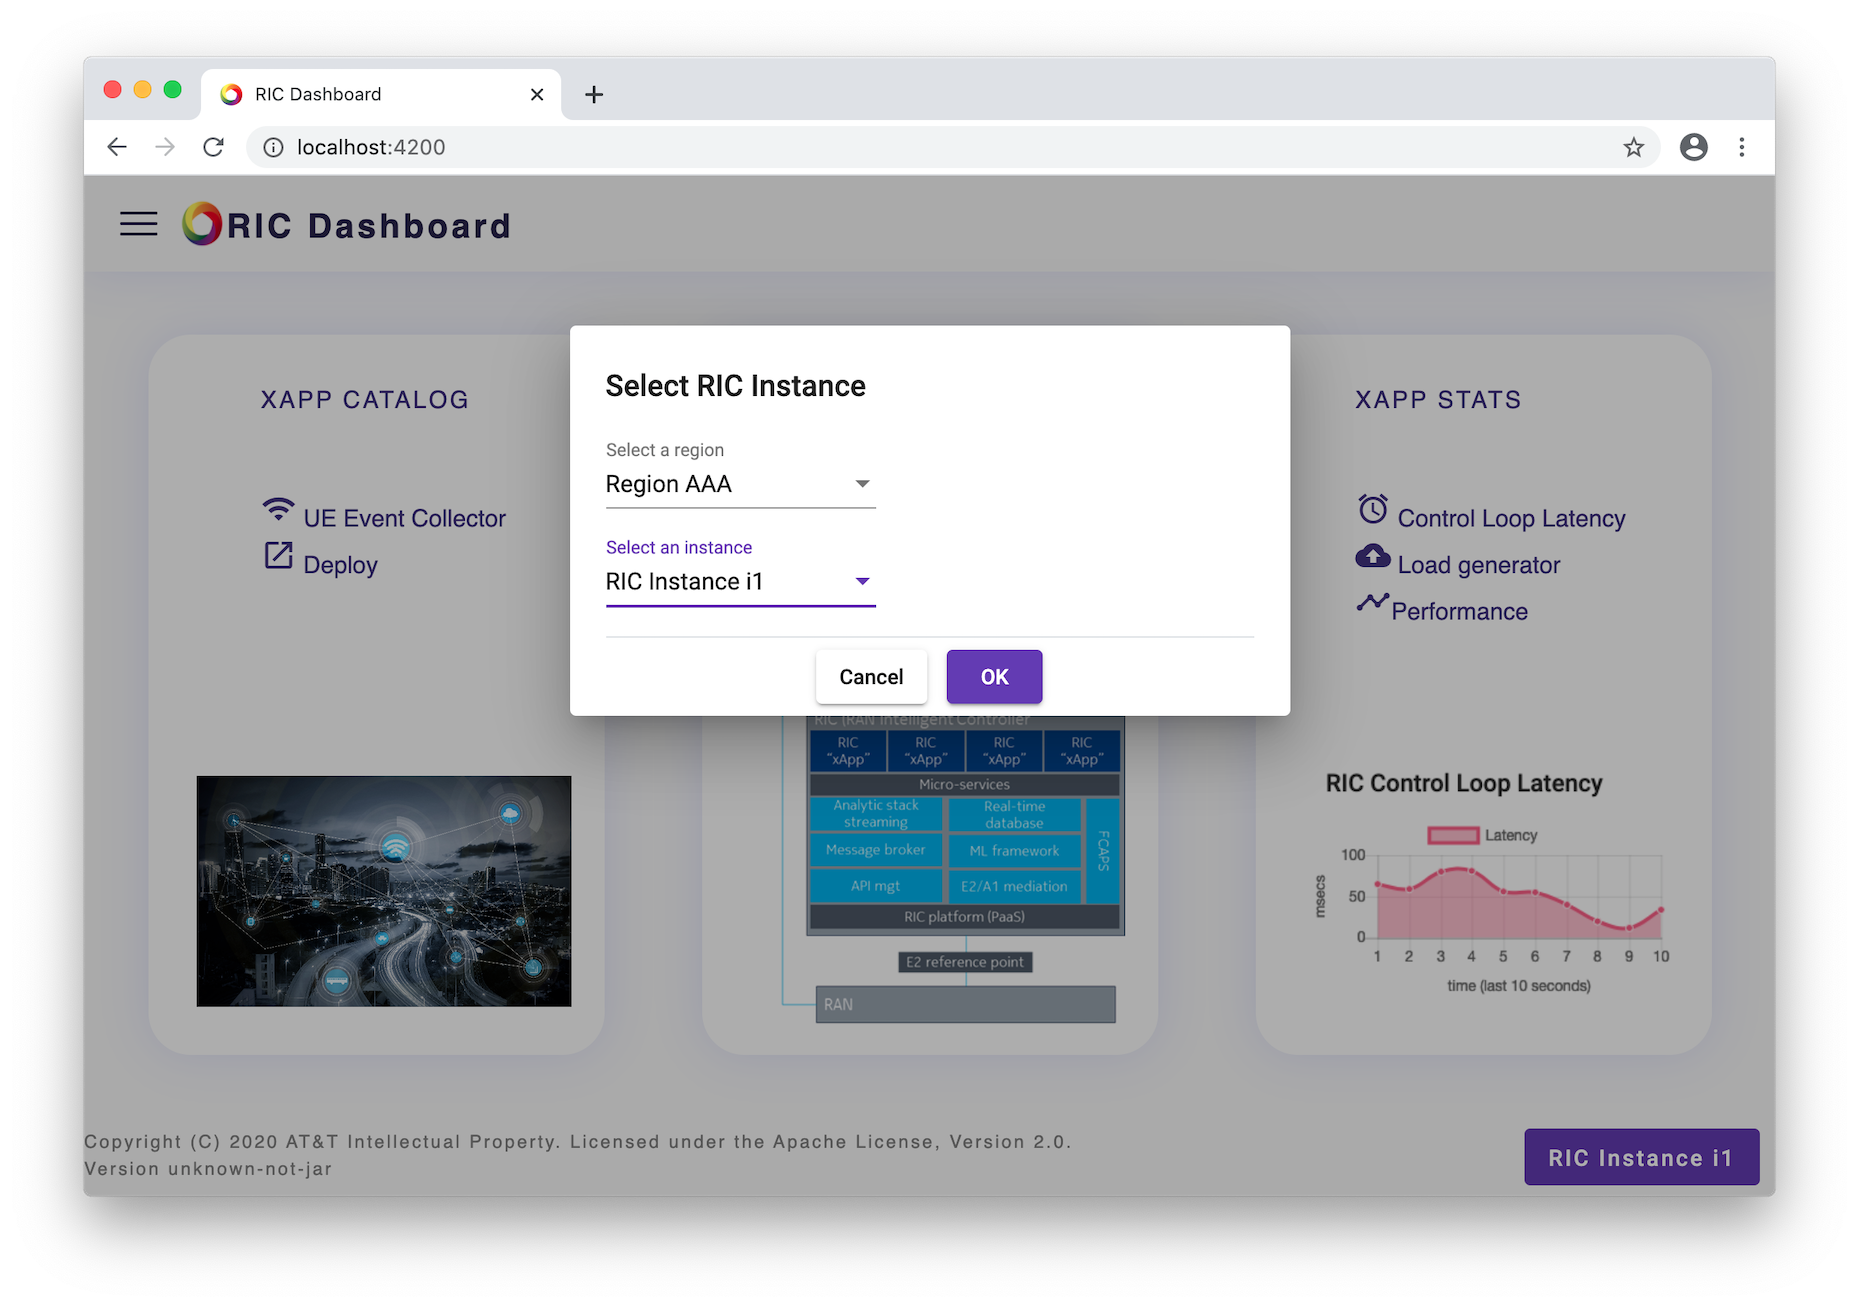
The Dashboard can be configured to manage multiple RIC instances. Instances are grouped into regions. Users can select the instance to manage by clicking on the button shown at the bottom right of the main page, which brings up the dialog shown below.
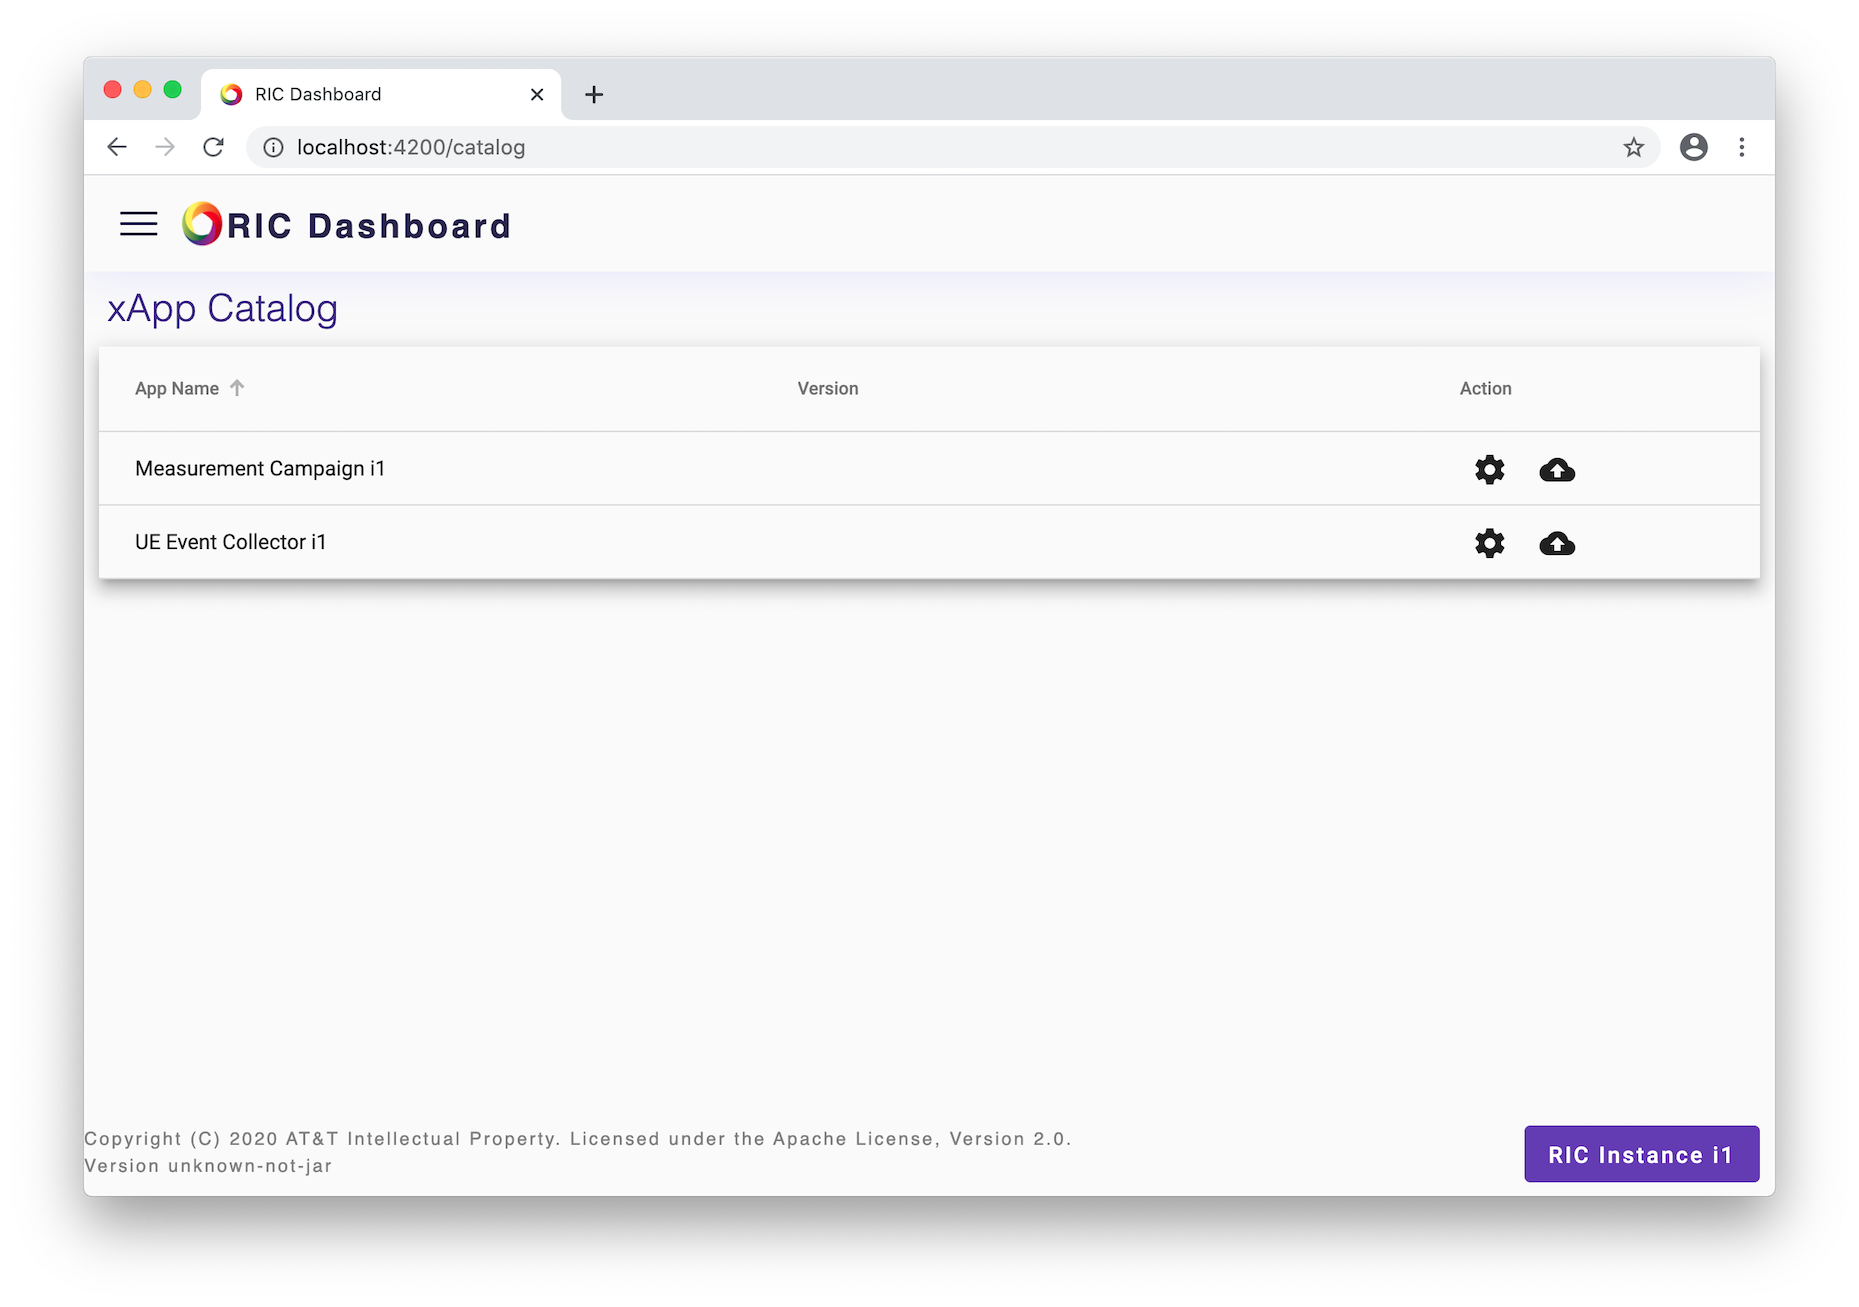
xApp Catalog
The catalog page shows all the applications that can be deployed to the RIC. Users may change static settings or deploy an application form this page. A sample screen shot is shown below.
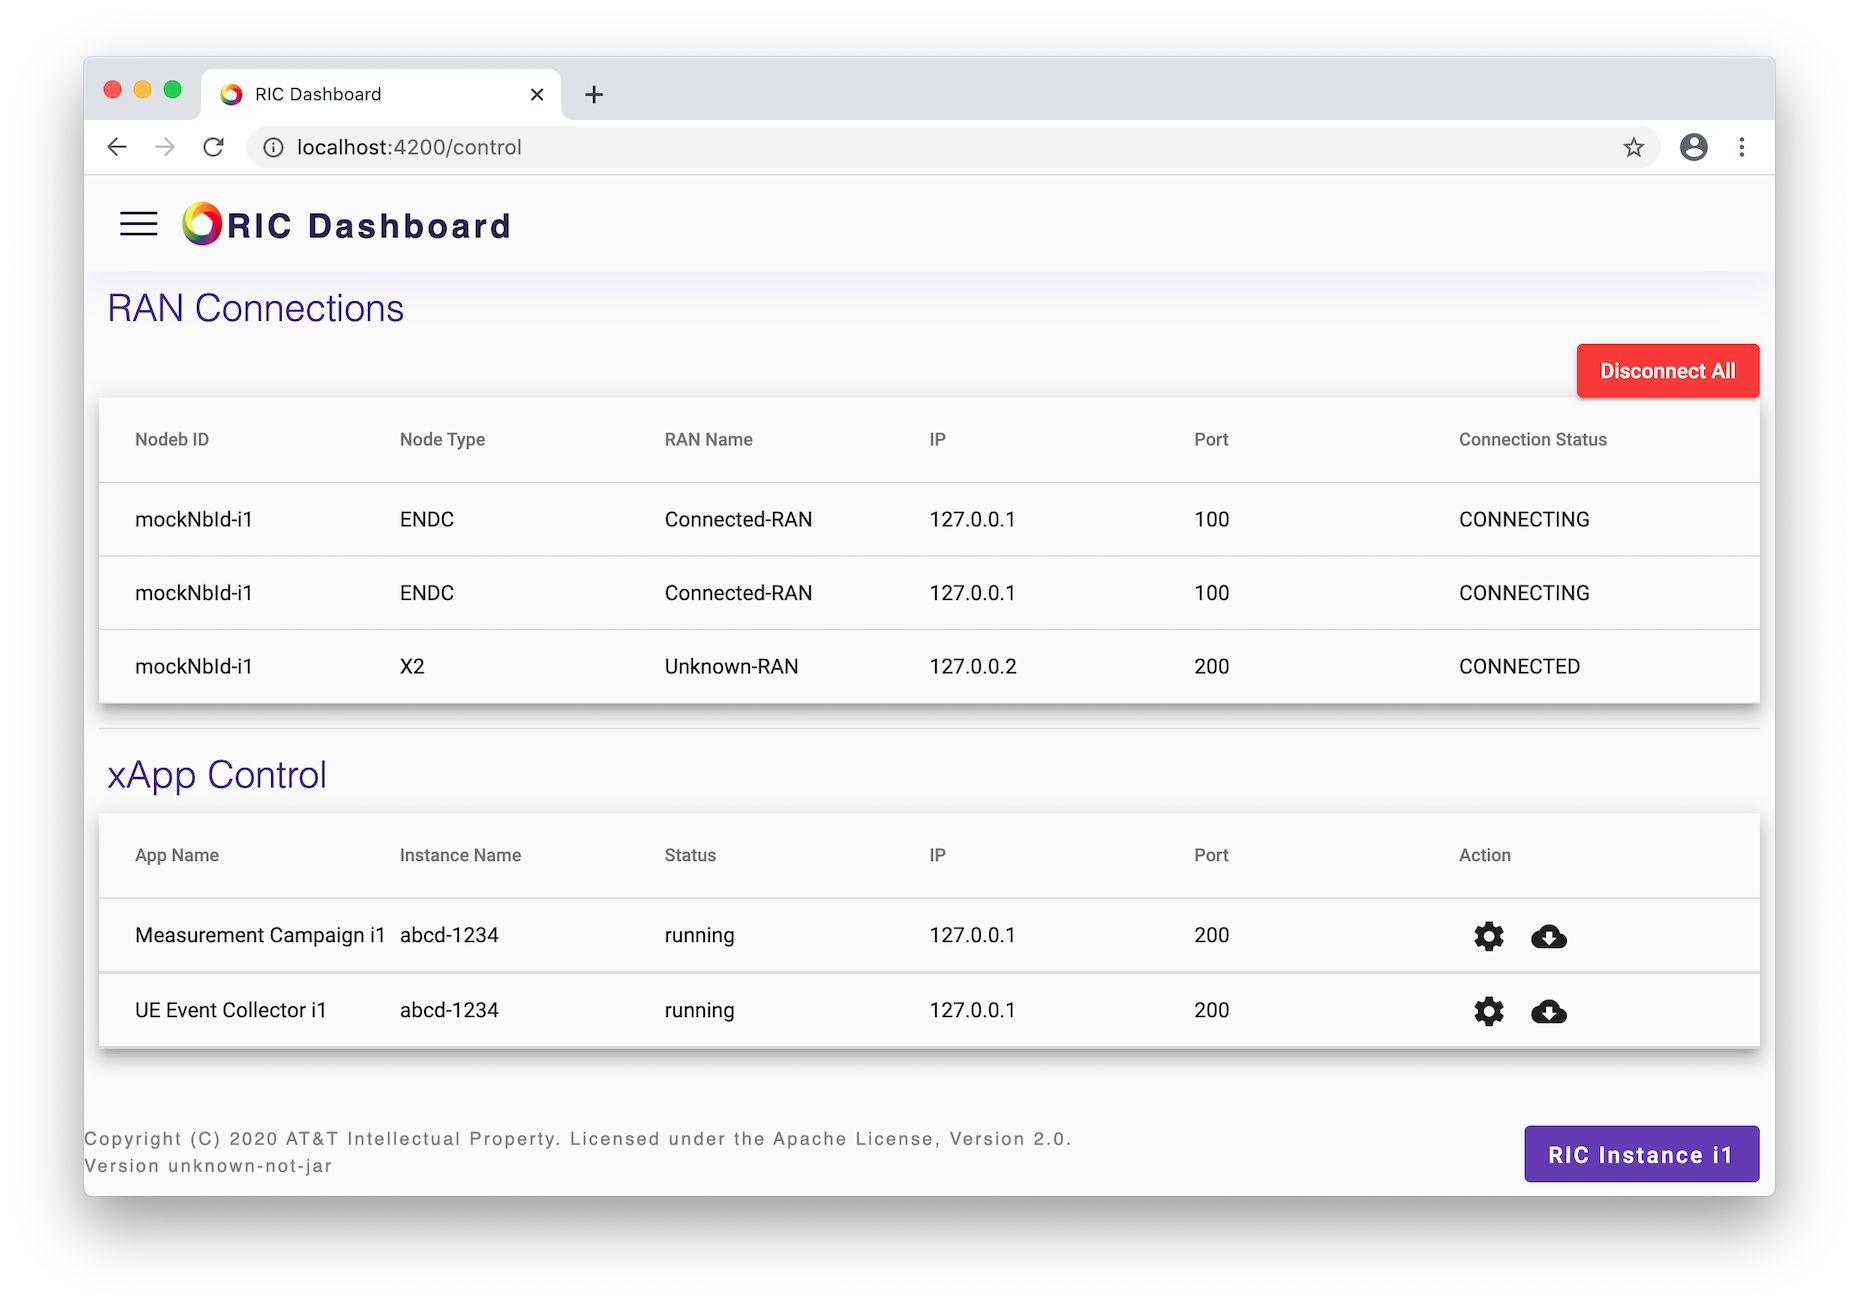
RIC Control
The control page shows the current RAN connections and the applications deployed to the RIC. Users may disconnect the RIC, adjust dynamic application settings and undeploy applications. A sample screen shot is shown below.
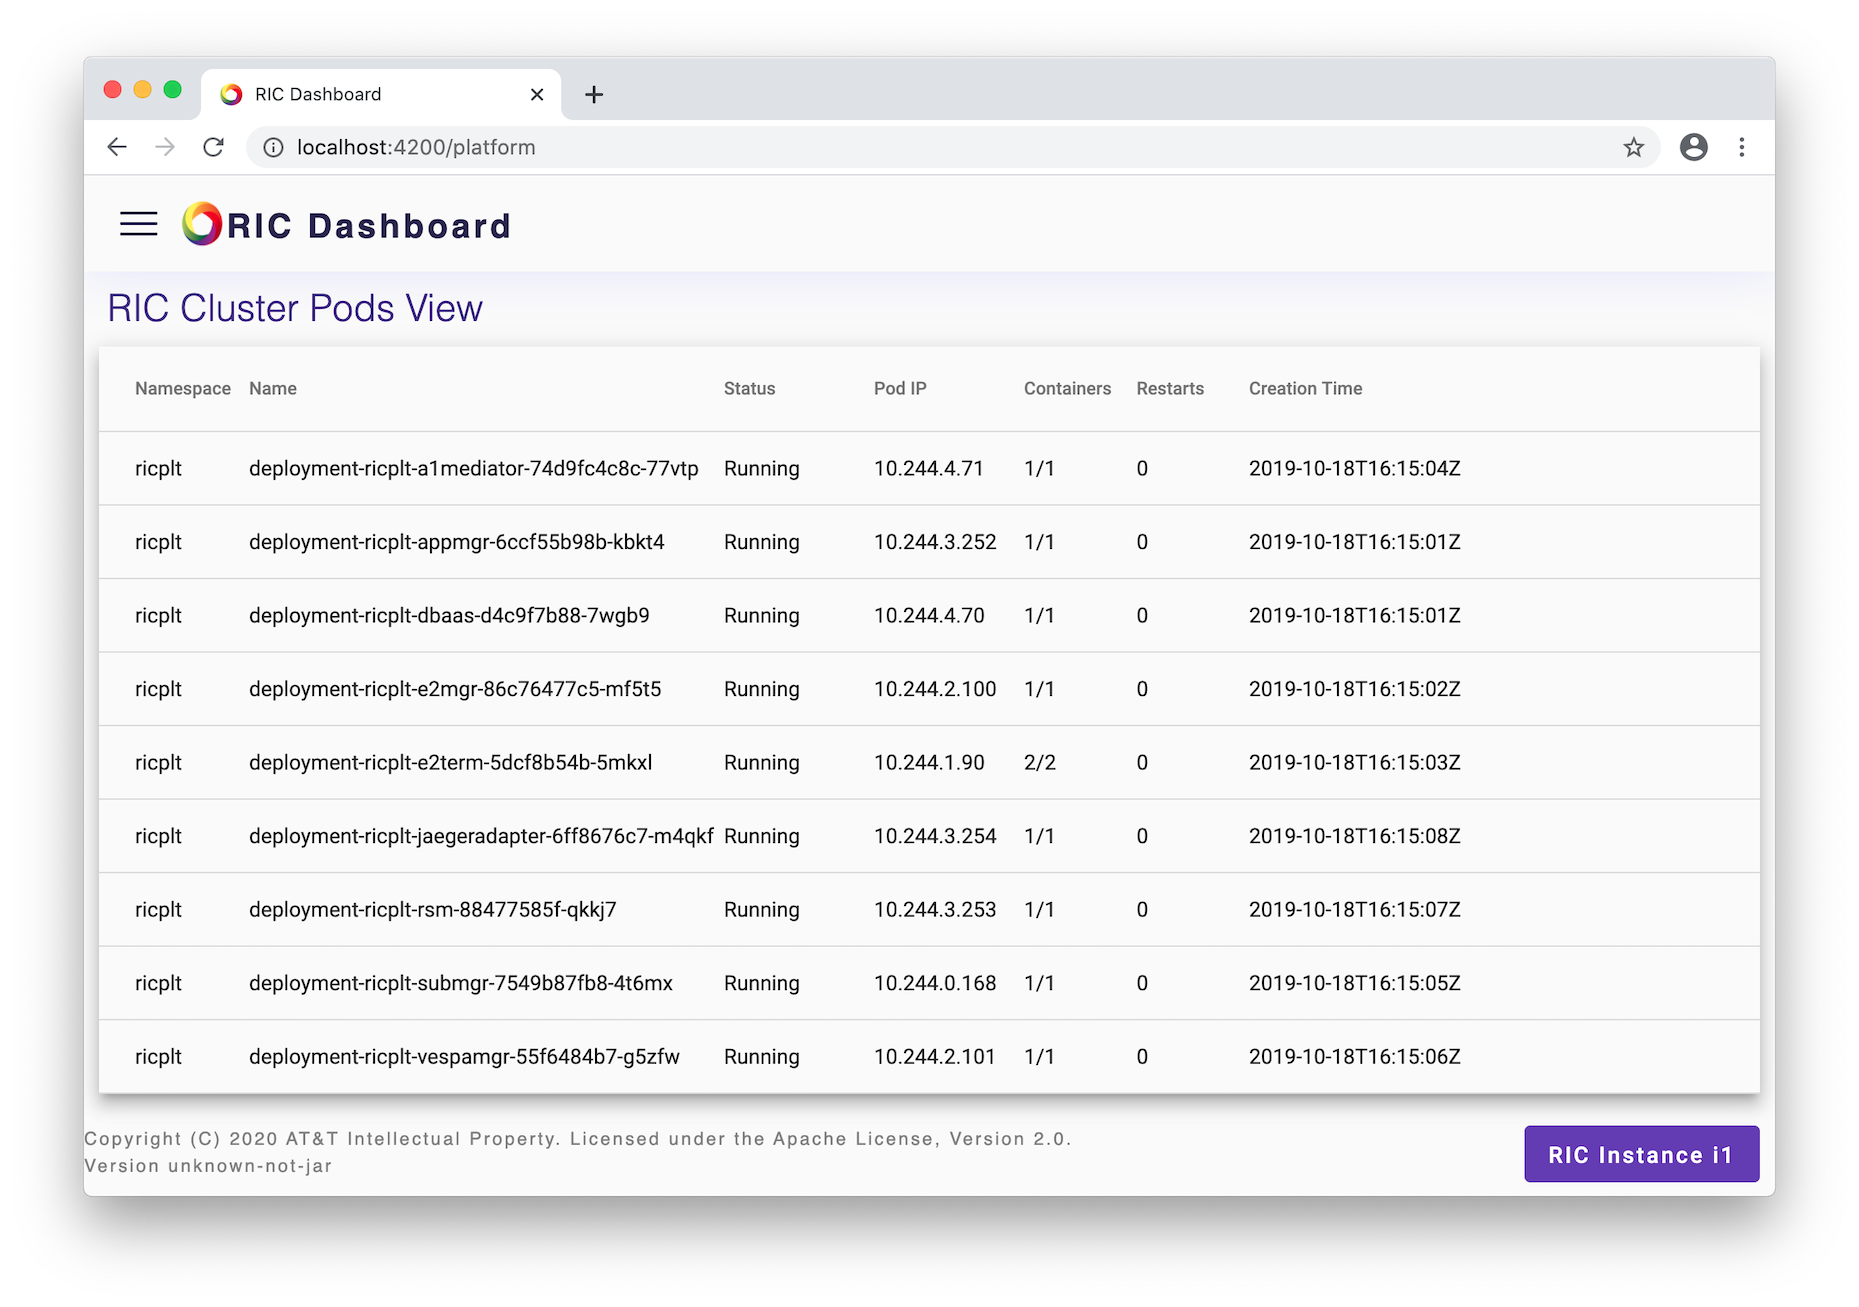
Platform Status
The cluster pods view shows the Kubernetes pod details. A sample screen shot is shown below.
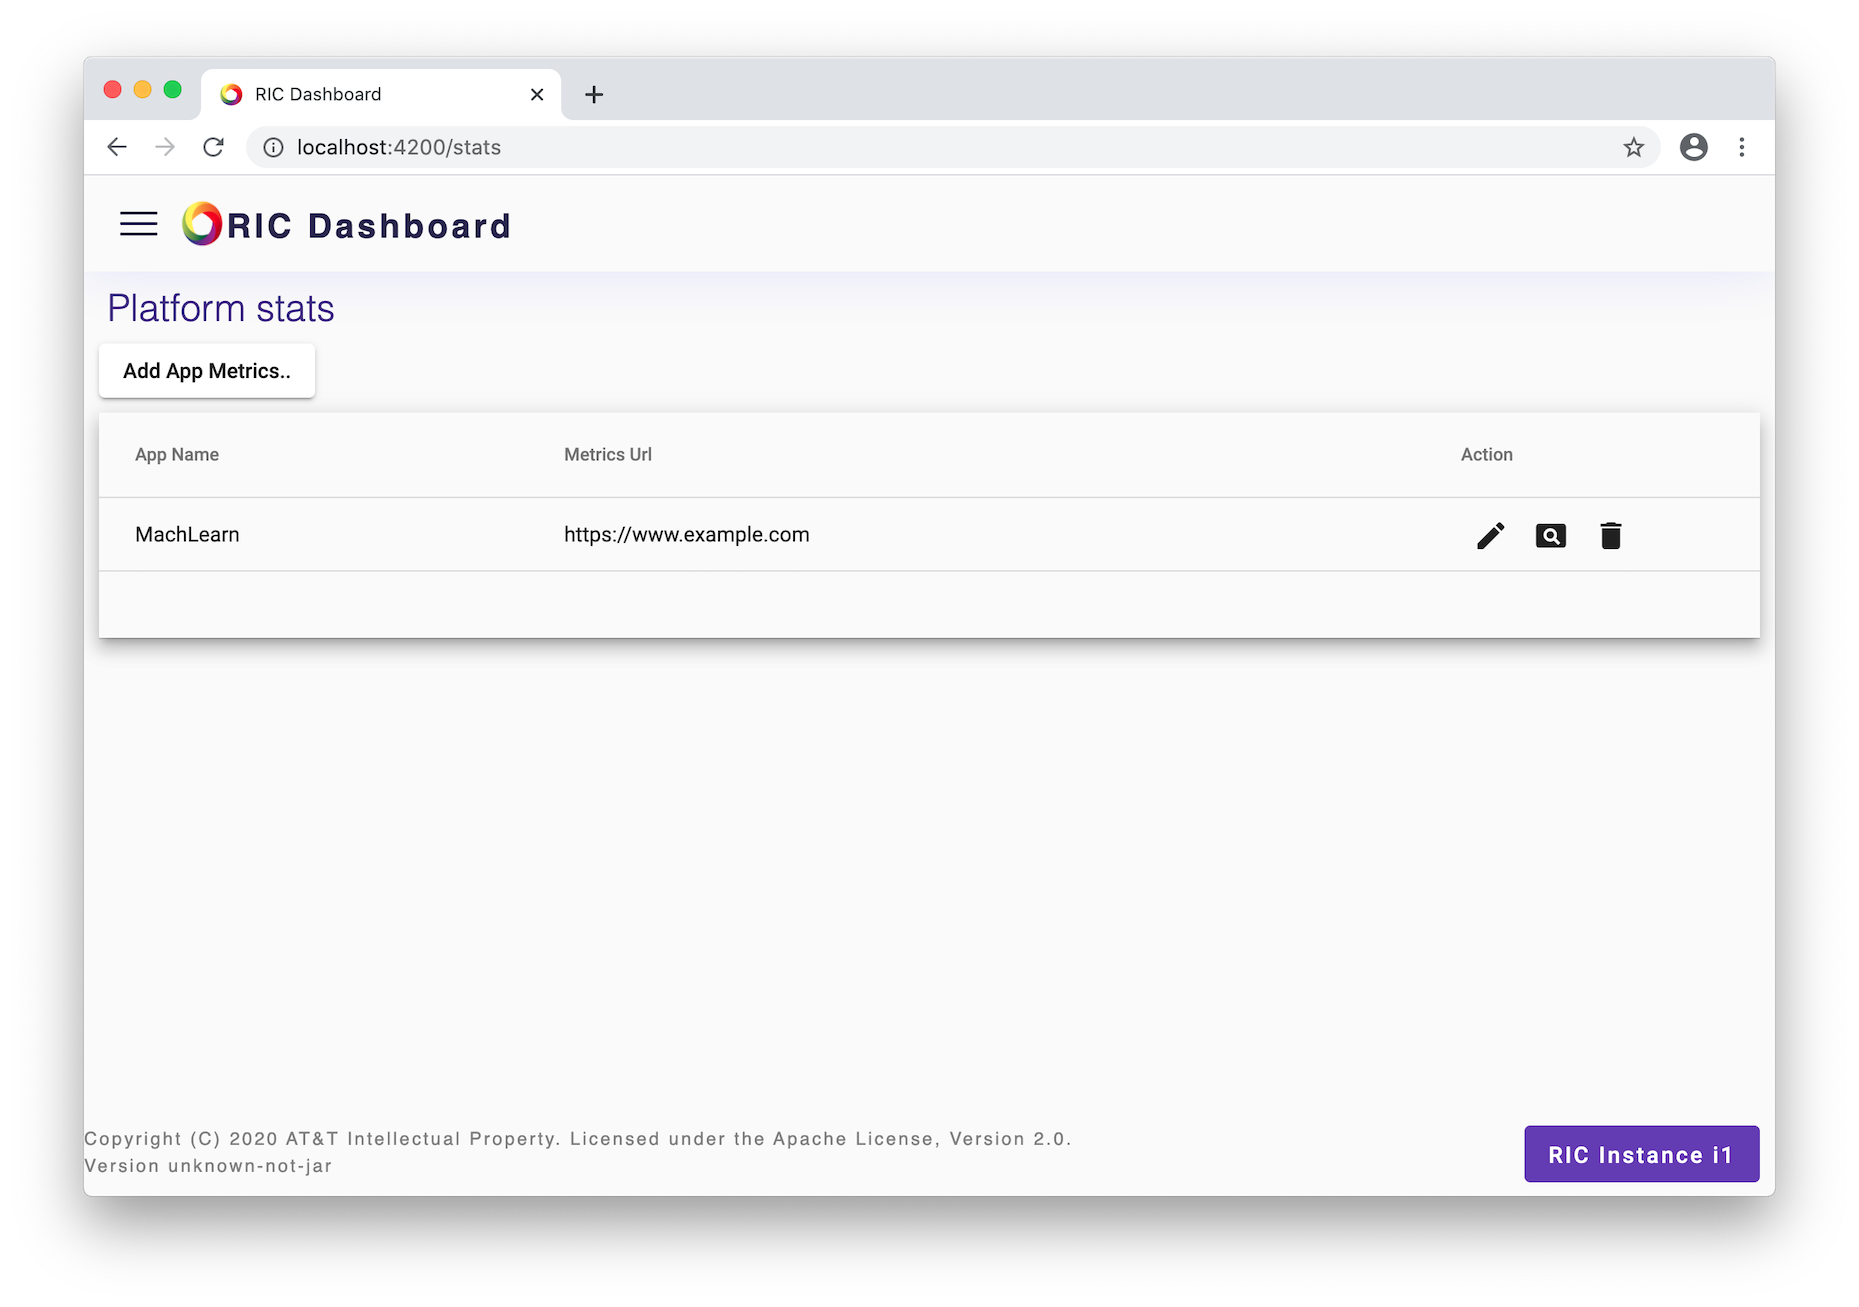
Platform Statistic Views
The stats page allows configuration of views that analyze and display statistics gathered by a remote system for applications deployed to the RIC. Users may add or remove views. A sample screen shot is shown below.